Sunday, February 10, 2008
Shot Accuracy Update
It's been a while since I've taken a look at the Devils' shooting. Now that we are 56 games into the season, an update is in order. For those of you not familiar of what I'm talking about, please read these two posts for background and prior analysis: Devils & Accuracy Part 1, Devils & Accuracy Part 2.
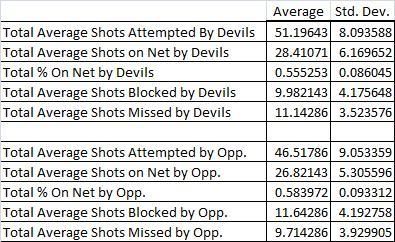
First, let's look at the overall numbers. The Devils are still routinely less accurate than their opponents, that's not good. However, they have improved by about a percent in terms of getting those attempts on net and this is verified by now having an average of 28.4 shots on net than 27.8 shots on net. The opposition is blocking an average of just under shot less and the Devils have had their average number of shots slightly reduced. Unfortunately, the opposition has been more accurate, credited by missing about one less shot per game as well.
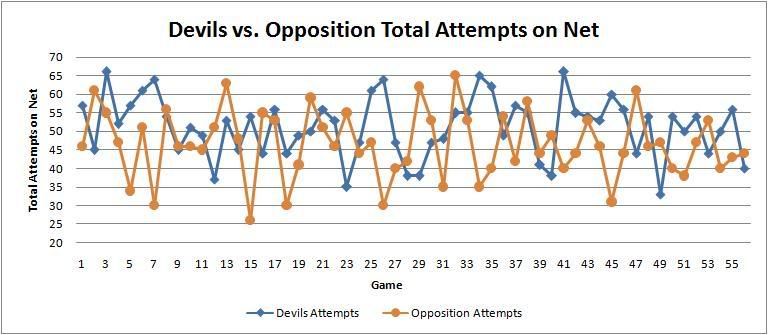
Now, let's see how the Devils have been doing over the last 56 games, trend-wise. Time for not just one, but two line graphs.
While the first chart states that, on average, the Devils generally make more attempts to shoot than their opponents. This even holds true in recent games, with a few exceptions here and there. The Devils hit a total low of 33 attempts in that brutal Montreal game a few weeks ago. Except for last night's game, the Devils make somewhere between 43 and 55 attempts which has been seemingly more consistent than the opponents have been. Over the whole season, there doesn't seem to be too much correlation between the Devils and the opposition. When it comes to comparing the percentage of those shot attempts getting on net, the opposition continues to be better. The Devils have been superior in the last two games, but since the last time I checked, there's been a total of four games where the Devils were more accurate than their opponents. The chart below reflects this. What's more, in those four games, the Devils won three of them.
Third, let's break this down between home games and away games. This means yet another chart with a brand new section to show difference between home and away games. Interestingly, the Devils are more aggressive on the road than they are at home. The terrible offense (only 33 attempts!) against Montreal probably skewed that, but with that aggression comes a drop in accuracy. The Devils average a little more than a shot on goal more in Newark than elsewhere, and average two fewer missed shots. They block more shots on average on the road, but so does the opposition. The opposition shooters must love playing at the Rock, though. They take fewer chances, perhaps due to the Devils style of play; but when they get an opening, they make them count with an astonishing 62% accuracy! Still, if the Devils want to up their overall accuracy, I would suggest making changes to their offensive approaches and shot selection on the road first. That's where the accuracy drop seems to lie.
Lastly, let's break it down between wins and losses. Just like the home-away chart, there's a new section to provide the difference between wins and losses in each category. It's even color coded to provide whether the difference is good (green) or bad (red). Interestingly, common sense is found in the data here. The wins by the Devils have them take fewer attempts, but be more accurate in their shooting - leading to more shots on net and presumably goals. Oddly enough they miss about the same number of shots on average (only an average of .32 more in losses), which tells me it's not hurting them greatly as the opposition blocking their shots. The missed shots stat tells me that the Devils are literally missing opportunities and with work in that area, they can improve their accuracy just by cutting that down. The opposition blocking an average of a little more than 2 shots in Devils losses means that is hurting New Jersey more than missing. Common sense rears it's ugly head as the opposition is clearly more accurate (and by quite a bit) when they win instead of when they lose.
Overall, I'd say that the Devils have made a small improvement since the first time I did this analysis about a month and a half ago. Any improvement is still improvement; but I urge the Devils and their coaching staff to make better decisions when it comes to shot selection. The data backs up the intuitive notion that the opposition is more accurate and gets more on net on average when they are succeeding. What's more, the Devils are not nearly as accurate on the road as they are at home - which provides a good first place to look for improvement.
Trading for a sniper or a stud defenseman may help in the short term; but this is a team-wide problem and trading an entire roster is nigh impossible - not to mention senseless. However, the team has to do a better job in making those many attempts on net hit the net. They are generally more effective in getting more attempts night after night; but the accuracy of those attempts is what makes them a good offensive decision. Working on shooting as well as deciding when to shoot in games - not the easiest thing to do with sticks and bodies going every which way in games - will lead to not only improved accuracy but likely more goals.
Trading for a sniper or a stud defenseman may help in the short term; but this is a team-wide problem and trading an entire roster is nigh impossible - not to mention senseless. However, the team has to do a better job in making those many attempts on net hit the net. They are generally more effective in getting more attempts night after night; but the accuracy of those attempts is what makes them a good offensive decision. Working on shooting as well as deciding when to shoot in games - not the easiest thing to do with sticks and bodies going every which way in games - will lead to not only improved accuracy but likely more goals.
Labels: 2008 Season, Devils Issues


