Saturday, May 31, 2008
Hitting Analysis of 2007-2008 Part 1
While I can't say I enjoy fighting in hockey, I do enjoy the hitting. The physical part of hockey is a part of what makes hockey so great and just by playing in the NHL, you have to be one tough player. You literally have to battle other people for position, for the puck along the corners, and to even make a statement - all through the medium of body checking. Big hits can change the momentum of a game, or at least provide a cool highlight for the fans of the player who threw the hit. But checking into the boards after a loose puck or those little pushes in front of the net can become important in terms of getting an advantageous position or even puck possession, so they count too.
If you were concerned that the Devils didn't have enough physical players last season; then you were likely pleased with what happened last offseason when the Devils signed Vitaly Vishnevski and Aaron Asham; you probably enjoyed seeing David Clarkson getting a regular spot on the roster; you may have applauded the decision to bring in Bryce Salvador in for the benched Cam Janssen; and you appreciated Brent Sutter's idea for a majority of offensive attacks to consist of dumping-chasing-and-then-battling-along-the-boards for the puck to some degree. Basically, from what we saw on a game to game basis, the Devils were a more physical team due to who they signed and how they played.
Hits are a bit tricky to measure. As it states in Hockey Analysis statistics section, hits are a real time super stat which are often left up to the scorekeeper as to whether something is or is not a hit. Given that every arena has a different scorekeeper, some are more generous and some less generous. Hockey Analysis rectifies this by adjusting the stats. And we should like their adjusted numbers as they show the New Jersey Devils to have a higher total of hits than any other team in the league. I am not making this up. The adjusted numbers at Hockey Analysis state that New Jersey likely truly had 1729 hits.
However, I can't really just leave it at that, as nice and easy it would be to do. While I admit that subjectivity does play a role in counting hits at games, I am going to use those numbers from the scorekeeper for hits anyway. They are what is officially recorded in the boxscores and at NHL.com and I really can't justify any adjustment or metric to be fully accurate - especially involving multiple seasons and players who only played part of the season with New Jersey. Even if I watched 186 games over the last three seasons again and counted it myself, there'd still be questions as to whether the counts are accurate (not to mention that this would take forever). So there we are. We are also going to assume that if you're in the act of hitting somebody, you're being physical. Granted, you can be physical by taking hits - but that could also be done by not being particularly aware of the opposing skaters.
In any case, the first thing I looked at is who had how many hits for the Devils in the past 3 seasons. I chose the last 3 seasons because I'm still able to look at game reports and super stats for individual games as far back as 3 seasons ago to find out how many hits a Devil had before (or after) they became a Devil. Now, I did my best with this, and I know my 2007-2008 and 2006-2007 totals are valid due to Hockey Analysis coming up with the same totals in 2007 and 2008. That said, if you find anything wrong with this, please let me know so I can correct it and adjust my own conclusions. That all said, here comes two carts. First is for the players, second are the totals:
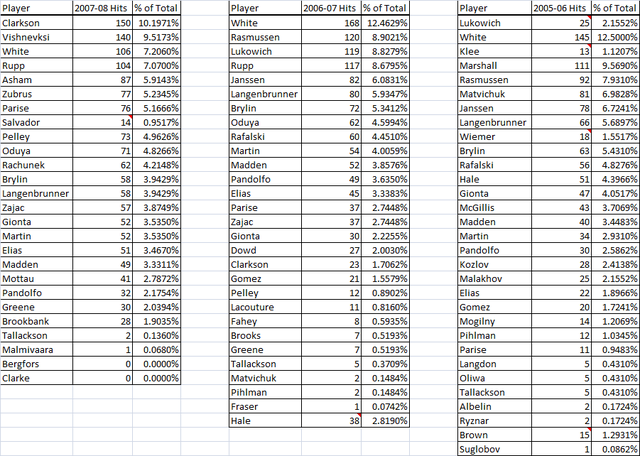
(Note: Those red triangles? Those are for players who didn't play the full season with New Jersey.)

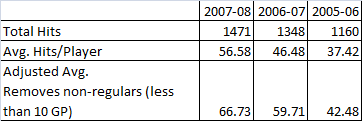
Now, these two charts tell us three things right off the bat. The first is that the Devils have had more hits this recent season than in the prior two seasons. This is true both in totals and in hits per player. So if you wished for the 2007-2008 Devils to be a more actively physical team, it came to true. The second is that the Devils have accomplished this with a much smaller roster. That doesn't say so much about the team's physical play, but it says quite a bit about the players the Devils used this past season. They only had 4 players for spot duty, as everyone else played a fair amount of games. In the 2006 and 2007 seasons, the number of players who got a "cup of coffee" with New Jersey was larger. Sutter seemed generally comfortable with who was on the active roster, and injuries didn't rock the team so much to the point where they had to call up players for a significant amount of time.
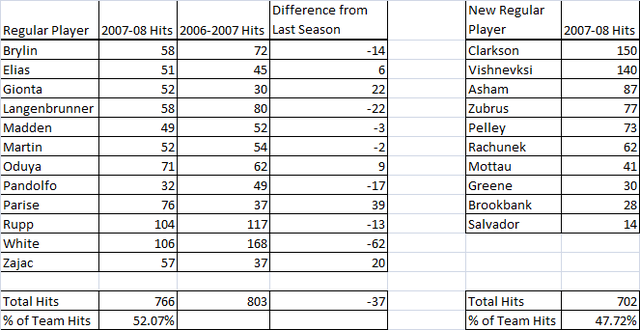
Anyway, the third thing is shown when you break it down to average number of hits per player. While some players on the team had fewer hits, like Colin White registering 62 fewer hits and Jamie Langenbrunner finding the body 22 fewer times (yes, I know they were out until mid-November, but it's still a big decrease in hits), the new players and the team overall has picked up the checking slack to a new high. While we hoped he produced more points, Brian Gionta did put on 22 more hits than the prior season. Travis Zajac had a season dominated by a sophmore slump except in hits, as he earned 20 more hits. Zach Parise doubled his hit totals from 37 to 76. John Oduya and Patrik Elias had some gains as well. However, those who were already regulars prior in 2007-2008 did see a drop in hits. Those who really put the Devils to new heights in hits who became regulars (free agents, prospects moving up) for the Devils in 2007-2008.
This confirms the physical play of Clarkson and Vishnevski being paramount. They both lead the Devils in hits in first and second, respectively. While Aaron Asham wasn't particularly great, he definitely brought the pain for 82 hits and it surprised me to learn that Dainius Zubrus got 77. Rod Pelley didn't stick for the whole season, but he played enough on the fourth line as a checking center, in both senses of the term. The rest of the new defensemen round out the list.
So these numbers show that the Devils have more hits both in total and in average. Why were these gains made? Well, this third chart shows that the new players have made a significant contribution. They represent just under half of all hits by the Devils, they include the two leaders in hits by the team, and they are largely physical players. With the percentage of hits from each player in this season being more spread out, that would be a result of the new style of play that Brent Sutter had the Devils utilize - with more physical battles along the boards on offense. The numbers in this manner, I think, help confirm what we may of originally thought.
That concludes part 1. Just like with what I did for the Devils' shooting numbers, part 2 of this will look at how often the Devils when they outhit their opponents. From there, I will attempt to determine whether there is a connection between winning and hits. If you have any questions, complaints, or insights, please let me know so I can make these attempts better.
Anyway, the third thing is shown when you break it down to average number of hits per player. While some players on the team had fewer hits, like Colin White registering 62 fewer hits and Jamie Langenbrunner finding the body 22 fewer times (yes, I know they were out until mid-November, but it's still a big decrease in hits), the new players and the team overall has picked up the checking slack to a new high. While we hoped he produced more points, Brian Gionta did put on 22 more hits than the prior season. Travis Zajac had a season dominated by a sophmore slump except in hits, as he earned 20 more hits. Zach Parise doubled his hit totals from 37 to 76. John Oduya and Patrik Elias had some gains as well. However, those who were already regulars prior in 2007-2008 did see a drop in hits. Those who really put the Devils to new heights in hits who became regulars (free agents, prospects moving up) for the Devils in 2007-2008.

This confirms the physical play of Clarkson and Vishnevski being paramount. They both lead the Devils in hits in first and second, respectively. While Aaron Asham wasn't particularly great, he definitely brought the pain for 82 hits and it surprised me to learn that Dainius Zubrus got 77. Rod Pelley didn't stick for the whole season, but he played enough on the fourth line as a checking center, in both senses of the term. The rest of the new defensemen round out the list.
So these numbers show that the Devils have more hits both in total and in average. Why were these gains made? Well, this third chart shows that the new players have made a significant contribution. They represent just under half of all hits by the Devils, they include the two leaders in hits by the team, and they are largely physical players. With the percentage of hits from each player in this season being more spread out, that would be a result of the new style of play that Brent Sutter had the Devils utilize - with more physical battles along the boards on offense. The numbers in this manner, I think, help confirm what we may of originally thought.
That concludes part 1. Just like with what I did for the Devils' shooting numbers, part 2 of this will look at how often the Devils when they outhit their opponents. From there, I will attempt to determine whether there is a connection between winning and hits. If you have any questions, complaints, or insights, please let me know so I can make these attempts better.
Labels: 2008 Season, Devils Analysis, Devils Issues
# posted by John Fischer @ 6:53 PM 0 comments 
